Pricing SaaS-based products
For startups that sell software as a service (SaaS), the pricing focus shifts away from gross margins to customer lifetime value (CLTV) and its relationship to the cost of acquiring customers (CAC). It’s not that gross margin isn’t important — all businesses need to be profitable at some point — but the information contained in the CLTV and CAC numbers has a more significant impact on a startup’s pricing and growth strategy.
Typically, SaaS companies offer plans or packages that include a combination of speed, capacity, number of users and support level, depending on the nature of their product and what would make sense from a customer value perspective. To avoid potential customers stumbling when making their decision, the best practice is to create a few clear options to choose from.
Example: Netflix
For instance, Netflix offers three different packages.
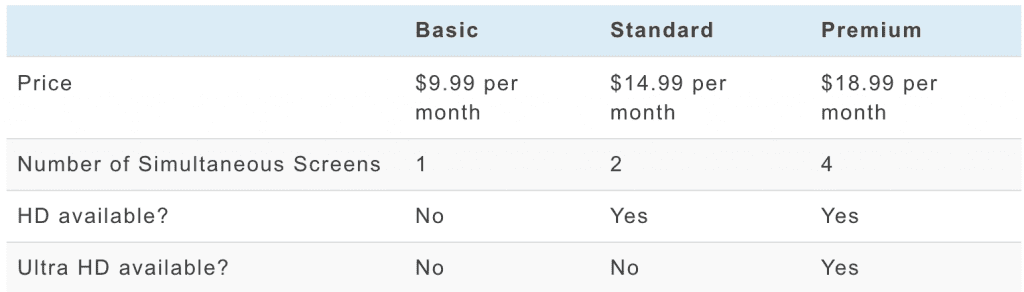
Source: How Much Is Netflix Canada? (2021)
It is quite common to start with relatively modestly priced plans and increase the recurring charge five to 10 percent annually.
The table below shows how the monthly charge for the Netflix Standard package has changed over time.
| Year | Monthly charge |
| 2016 | $9.99 |
| 2017 | $9.99 |
| 2018 | $10.99 |
| 2019 | $13.99 |
| 2020 | $14.99 |
Note: Netflix typically raises prices late in the fall, so the table above isn’t 100 percent accurate. The monthly charge and rate of increase may differ for individuals based on special offers and location.
Calculating CLTV
Customer lifetime value shows the monetary value you can expect from a single customer. It is calculated using the following information.
- Longevity of relationship: The longer you have a relationship with the customer, the higher the value. It’s also referred to as average customer lifetime (ACL). The inverse metric of ACL is churn, which is the percentage of customers who leave monthly or annually; churn is sometimes used instead of ACL.
- Average annual or monthly recurring revenue per account (ARPA): The higher the amount, the higher the customer value, but if the monthly amount is too high, it may impact the longevity of the relationship and create space for disruption. If the product or plan has a direct per-unit cost associated with sales and delivery, that should be subtracted from the ARPA to achieve a more accurate calculation. Similarly, you would get a more realistic CLTV if you subtracted the average cost of customer service and support from your plan price.
- Discount rate: This is your cost of capital, also referred to as weighted average cost of capital. Note that the discount rate isn’t always used when simplicity in the calculation is preferred. For instance, if you are mostly interested in a time horizon of three years or less, cost of capital is less significant than if you are considering a longer period.
The process for calculating CTLV:
1. Average customer lifetime
The ACL may be calculated in months or years, depending on what’s most useful for you. Here is an easy way of arriving at the ACL using percentage of customer retention.
Compare how many of your customers at the beginning of the period are still your customers at the end of it. For instance, if you started the year with 10 customers and eight of those are still with you at the end of the year, you have 80 percent customer retention. If you lose 20 percent of your customers per year, it means all Year 1 customers have left at the end of Year 5, making the ACL three years (the median year). Using percentage of customer retention has the advantage of allowing you to make the assumption about retention relatively early and not having to wait for actual data for the following years. The problem with using this approach is that startups tend to improve customer retention over time or switch target segments, so early retention data may not be as valid for longer-term calculations.
Actual lifetime data for a cohort of customers would, of course, yield a more accurate ACL calculation, but startups typically won’t have quality retention data on an annual basis until they have been operating for several years (so long, that it almost defeats the purpose). However, if you are able to calculate retention on a monthly basis, you can use actual lifetime data for a cohort to calculate ACL relatively early (within 12 to 18 months you should have an idea of what the churn is).
Please note that customer retention doesn’t always equate to revenue retention, especially if you have a variety of customers. David Skok, who has written extensively about SaaS pricing, suggests tracking both customer numbers and revenue over time to understand the degree to which they diverge. He’s made the point that if you lose some customers but more than compensate for the revenue loss through price increases and upselling, the actual impact of the churn is positive for the business, as you’re essentially losing low-ARPA customers (although most of the time, the picture is not as clear).
2. Average annual or monthly recurring revenue per account
For standardized products and plans, calculating ARPA is relatively straightforward. The example below illustrates the calculation.
| Plan | Price | Share of customers | Weighted share |
| Basic | $100 | 50% | $50 |
| Standard | $200 | 30% | $60 |
| Premium | $350 | 20% | $70 |
| ARPA | $180 |
For more accurate calculations over a longer time period, you’d add a price increase factor to the equation.
Simple CLTV calculation:
Formula: CLTV = ACL * ARPA
Calculation: CLTV = 3 * $180 = $540
Calculating CAC
The cost of acquiring customers is calculated the following way:
Sales expenses + marketing expenses
#New customers acquired
In the early days, when you have few customers, this calculation is easy. But as more of your sales and marketing efforts become dedicated to keeping and maintaining your customer base, it is important to ensure you can identify which of your sales and marketing expenses — including the team’s time — can be attributed to generating new business. Certain overhead costs may be challenging to accurately allocate to either new customer acquisition or maintaining and growing existing accounts. For example, if sales, marketing and customer success rolls up to the same leadership team, what percentage of their time is spent on new versus existing business?
Calculating CAC – an example:
| Q1 2021 | ||||
| January | February | March | Q1 totals | |
| Marketing cost | $720 | $730 | $740 | $2,190 |
| Sales cost | $180 | $130 | $140 | $450 |
| Total | $900 | $860 | $880 | $2,640 |
| % for new biz | 85% | 90% | 80% | 85% |
| New biz cost | $765 | $774 | $704 | $2,244 |
| New customers | 10 | 12 | 15 | 36 |
| Monthly acquisition cost | $76.50 | $64.50 | $46.90 | |
| CAC for the quarter | $62.30 | |||
Understanding the relationship between CLTV and CAC
When calculating CLTV and CAC, there are a couple of insights we are interested in.
1. The ratio between CLTV and CAC: In an ideal world, the ratio is 3:1, meaning CLTV is three times CAC. It is generally accepted that a 3:1 ratio will allow for sufficient investment in growth and drive profit. Entrepreneurs should be aware that most businesses don’t even get close to this ratio until they have around $5 million in revenue. At lower volumes, the CAC tends to be higher and CLTV lower. If the ratio is too low, price increases or plan adjustments should be considered.
In our example case, we have:
CLTV = $180
CAC = $62.30
Without doing the math, we can see that the ratio is almost 3:1 for the quarter, and the monthly breakdown shows we’re heading in the right direction.
2. The development of CAC over time: One of the biggest challenges for entrepreneurs is not building a differentiated product but rather building a business model and customer acquisition process that is predictable and scalable. By far, too many startups suffer from high and unpredictable CAC, making it a key metric for any SaaS-type business to track and actively manage over time.
Some notes regarding B2B versus B2C
The example we used above is for a B2C, but the principles and methodology apply equally in a B2B setting. Here are a couple of key differences to keep in mind for B2B.
- Plan pricing: In B2B, you may want to avoid the consumer-price optics of pricing at $0.99 levels, because there is the risk that it will devalue your offering. Consider how other offerings in your category are priced before posting your own plan prices.
- Accommodating all needs: Early on, it may be hard to design plans that cover the access and capacity to fit every business, so create an option that encourages customers to contact you if they don’t see a plan that meets their needs. As you learn more about your customer needs, you may create additional standard plans that meet the most common requests you receive. The balancing act is that you don’t want too many plans to manage so the focus should be in finding the workable breakpoints between each plan level.
- Enterprise: For companies selling to businesses, it is common to offer an email address or chat option for customers looking for enterprise solutions. Typically, enterprise solutions cover the needs of a large number of users, potential integration with relevant systems in the client organization, as well as hosting, data management and security arrangements. The complexity of such solutions mean they must be priced at different levels than standardized plans.
Further resources
- David Skok is a recognized authority in the field. He covers SaaS metrics and related business issues: https://www.forentrepreneurs.com/ltv/
- Cloud Strategies shows how to build out a sophisticated model for CLTV and CAC: http://cloudstrategies.biz/dont-be-a-customer-lifetime-value-simpleton/
- Ben Murray, a long-time CFO of SaaS companies, offers a very practical article: https://www.thesaascfo.com/calculate-customer-lifetime-value-cltv/
- Tech Daily (March 2021): How Much Is Netflix Canada? (2021)
 Jon E. Worren